
You will take about 22,000 breaths today. That equates to an average of about 917 breaths per hour and 15 breaths per minute. For billions of people around the world every breath is exposing their bodies to increasing levels of air pollution, which may cause short term health effects (such as rashes, headaches, asthma attacks) or may contribute to the risk of chronic diseases such as cancer, cardiovascular disease and Parkinson’s.
The World Health Organisation (WHO) predicts that air pollution is associated with 7 million premature deaths worldwide. However, in most cases, air pollution is the invisible killer which only clearly manifests itself by increasing the incidence of various long-term diseases at the population level. This is sadly not always the case as the deaths of Ella Roberta Debrah and Awaab Ishak demonstrate. Ella was the first person in the UK to have ‘air pollution’ cited as the cause of death on their death certificate and she passed away after a series of severe asthma attacks brought about by exposure to high pollution levels near London’s north circular road. One potential silver lining to this tragedy is that her death prompted her mother, Rosamund Kissi-Debrah, to campaign for the human right to clean air and now 10 years since Ella’s death, Ella’s Law or the Clean Air (Human Rights) Bill, named in her honour, has had its second reading in the House of Lords. Our fingers are crossed that it is approved by both Houses and becomes law as soon as possible. Sadly, Ella is not the only child whose death was directly caused by air pollution; two-year-old Awaab Ishak recently died of chronic exposure to mould, and black mould spores, in his family’s flat, highlighting the importance of indoor air quality.
Psychologists have suggested that as a species, we struggle to confront issues that we don’t perceive as presenting an immediate and present danger. Although, the deaths of Awaab and Ella are tragic, similar cases where air pollution is identified directly as the cause of death are rare. Like climate change, air pollution is not an obvious threat to our daily lives, and instead it is the invisible killer that, with every breath, is poisoning the citizens of the world.
Air quality is also, undoubtedly, a social justice issue. The Friends of the Earth recently completed an analysis which demonstrated in England, that people of colour are up to three times more likely to live in neighbourhoods with very high air pollution.
As air quality is an invisible killer, it is essential that people know where to find information about it and know how best to analyse the data. This blog post outlines a series of well-established sources of air pollution data in the UK and suggests analysis that can be done with the data.
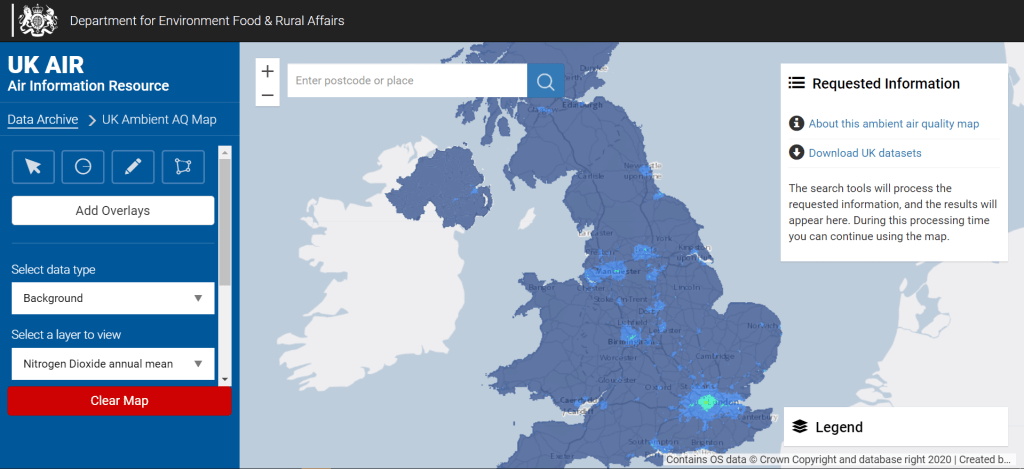
Defra/ UK-AIR Background Predictions
The UK Government’s Department for Environment and Rural Affairs (Defra) has modelled ‘background’ air pollution levels of nitrogen dioxide (NO2), nitrogen oxides (NOX) and particulate matter (PM2.5 & PM10) across the UK, at 1km*1km resolution. For each of the 154,846 data points, it provides a breakdown of the contribution to background concentrations from different sources including road traffic (broken down by minor and major roads, and motorways), railways, airports, points sources (such as power stations) and ports.
The resource does have some limitations. Firstly, air quality levels change continuously and are not consistent across 1km*1km grid squares. Air pollution concentrations peak near roads and other sources of pollution and as such, if somebody lives or works near to these sources, their ‘real’ exposure will likely be far higher than the grid-square average. This resource does, however, provide an excellent estimate of general exposure to pollution across the country and it was the resource that Friends of the Earth used to conduct their analysis on the distribution of ethnic minorities and air pollution.
The latest predictions can be found via this link.
London Atmospheric Emissions Inventory
The London Atmospheric Emissions Inventory (LAEI) provides modelled predictions of NO2, PM10 and PM2.5 at 20m-by-20m resolution across Greater London. Whilst the dataset does not contain a detailed breakdown of predictions at each data point by source type, at such low resolution, one can be reasonably confident that a spike in air pollution near a major junction is likely to be caused by road traffic there.
The latest predictions can be found at this link. A third-party company has visualised the 2016 version of the dataset, into an excellent map resource which can be found here.

National Air Quality Monitoring
Defra also manages a network of reference grade air quality monitoring stations that measure air pollution concentrations, in real time. There are several different networks, each of which monitor different groups of pollutants, including hydrocarbons, heavy metals, toxic organic compounds and NO2, PM10 and PM2.5. Data from these networks can be downloaded here.
Alternatively, for those with programming experience, the OpenAir package (written in R) provides a complete suite of tools for the easy download, processing and analysis of open source air pollution data from Defra’s network, as well as various networks across Europe. This data is available free of charge. The OpenAir project was funded by the UK Natural Environment Research Council (NERC), with additional funds from Defra. For further details on the OpenAir project, I strongly encourage you to follow this link to the OpenAir book, written by David Carslaw.
OpenAQ
OpenAQ is a non-profit organisation that seeks to empower communities across the globe through the sharing of open-source air quality data. OpenAQ has collated data from national monitoring networks (such as Defra’s monitoring networks) and individual citizens who manage their own air quality sensors. Currently OpenAQ provides access to monitoring at over 10,000 locations in 68 countries. When accessing data from this website, some care should be taken over the use of the ‘low cost’ sensor data as this data is less reliable than ‘reference grade’ options.

Breathe London
There are also several networks of ‘low cost’ air quality sensors that are popping up around the UK. These networks are bridging the gap between diffusion tube networks, which are inexpensive and are thus deployed at high spatial resolution and real time monitors which are very expensive and can only be installed at certain locations. Low-cost monitors use electrochemical sensors to measure air quality in real-time. Whilst they are often not accurate enough to measure concentrations at locations to ‘reference’ accuracy, they are very useful at showing trends and identifying hotspots.
The Breathe London Network is a “an air quality sensing network community made by Londoners for Londoners”, run by Imperial College London. The network uses Breathe nodes and is quotes as being a “perfect complement to regulatory monitoring”. Data is available for download for individual monitors at specific times here.
Friends of the Earth Citizen Science
Whilst this project has now been suspended, the Friends of the Earth (FOE) ran and developed a citizen science air quality network of diffusion tube monitors. Their air pollution map displays the results of all the monitoring undertaken. If using this data, it is important to note that air pollution concentrations are not simply influenced by the amount of pollution produced at a given time. Weather is a very important mediator of air quality, and it is often the case, in the UK, that we record our highest pollutant concentrations when weather conditions are stable for a prolonged period. The measurements at any given location in the FOE data only provide a ‘snapshot’ of NO2 concentrations, at a particular location, for a short period (often two to four weeks). Best practice guidance recommends that air quality should be monitored for at least three months to allow comparison with national annual mean air quality standards and to ‘smooth out’ the effect of any potential anomalous weather conditions.
Local Authority Data
In the UK, local authorities are required to manage and monitor air quality in their administrative boundaries. Often local authorities use passive, inexpensive ‘diffusion tubes’ to monitor air quality. Diffusion tubes must be manually put out and collected each month and are sent off to laboratories for analysis. There are many different laboratories across the UK and hundreds of local authorities; and as such, there is no centralised database where all this data is stored.
To find this data we recommend that you carry out a google search for the local authority’s ‘Air Quality Annual Status report’, which should contain their recent most air quality data. Please note that some links might instead refer you to regional air quality bodies such as Essex Air or Air Quality Northern Ireland.
Summary
If you found this post interesting, have a comment, or think I have missed an important resource, please comment and let me know. If you need any help with sourcing air quality data for your analysis or would like to collaborate in any way, please contact me.
