

This post is written for local authorities in the UK who are interested in identifying the principal source of air pollution in their local area, to support Air Quality Action Plans (AQAP) and Air Quality Strategies.
Local authorities are required to manage air quality in their administrative boundaries as part of their responsibilities under Part IV of the Environment Act 1995. Each year, every council should produce an Air Quality Annual Status report, summarising all air quality monitoring undertaken in the local area in that year. These reports are descriptive in nature and are focused on assessing compliance with the national air quality standards (AQS) .
Where exceedances of the national AQSs are found, local authorities are required to form an Air Quality Action Plan to bring pollutant concentrations within legal limits, in the shortest possible time. However, as there is a growing recognition that there are no safe levels for air pollution and that the measures to improve air quality can also minimise greenhouse gas emissions, there is a trend for councils to produce Air Quality Strategies that go beyond compliance and seek to bring concentrations in line with the WHO’s more stringent air quality guidelines.
Air Quality Annual Status Reports do not generally include a detailed analysis of the major sources of pollution, at any given location (i.e., detailed source apportionment work) and when required, councils will often commission specialist consultancies to undertake detailed air quality modelling, or additional monitoring. Given the economic climate, I wanted to share some examples of ways, local authorities can use freely available data to help identify major sources of pollution, which can be used to determine low emission policy objectives.
UK-AIR monitoring data
The UK-AIR information resource is an excellent website that includes an array of tools for the management of air quality, including the Met Office’s air pollution forecasts (AQI) for the UK; a detailed summary of all of the UK’s air quality management areas (AQMAs); access to real-time air quality monitoring; and modelled predictions of background air quality across the UK.
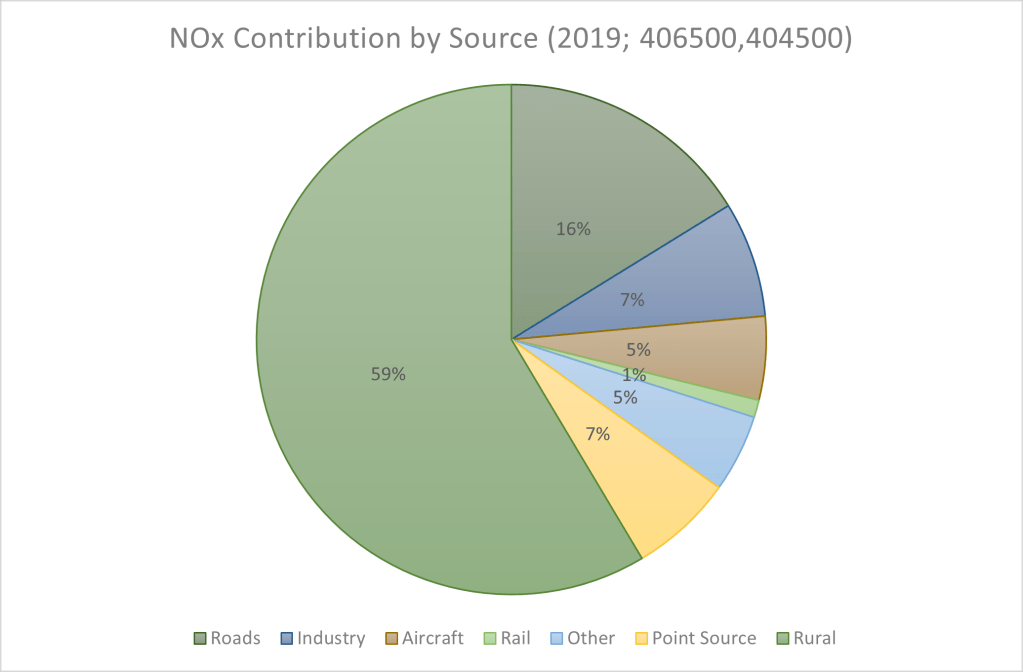
UK-AIR predicted background concentrations of NOX, PM2.5, PM10 and NO2 are the outputs of the national PCM model, which was designed to assess the UK’s compliance with the European ambient air quality directive (2008), at a 1km by 1km resolution. These high resolution predictions are broken down by source (e.g. road, industry, shipping), and also include an estimate of the contribution from adjacent grid squares. The dataset can therefore be used to determine the principal source of air pollution at any location in the UK, importantly, also identifying where closer cooperation with regional, or national bodies is required.
The datasets can be downloaded from the UK-AIR in the form of cumbersome spreadsheets (CSV files) and therefore, some form of visualisation is recommended to best utilise the dataset. The interactive figure below is an example of a way in which the data can be visualised in Tableau.

The graphic shows that in Canterbury district, road emissions dominate the background levels of NOX in the area. However, it also shows that domestic heating also plays a significant role, meaning that the Canterbury District Council might want to identify ways in which the domestic contribution can be minimised.
Traffic Counts and the Emissions Factor Toolkit
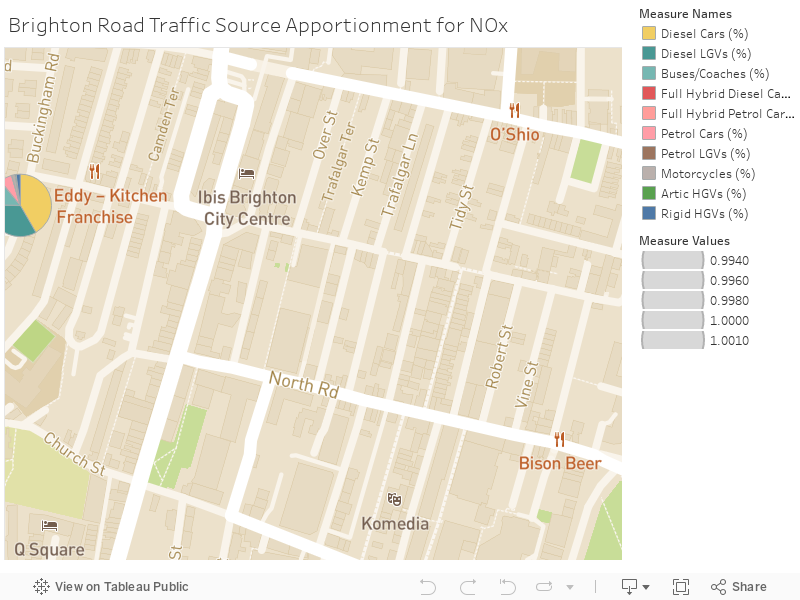
The Department for Transport has undertaken traffic counts of 45,576 roads in the UK. This data can be fed directly into Defra’s Emission Factor Toolkit, a resource which estimates vehicle emissions of NOX, PM10, PM2.5, or even CO2, broken down by vehicle type. As such, this tool is not only important for identifying the main contributors to roadside air pollution, but also for helping Councils identify major sources of CO2 and CO2 equivalent. The outputs of the Emission Factor Toolkit can either then be represented in traditional pie charts, or geo-referenced and overlain as a layer on a map to identify the major sources of pollution, per road link.
These tools, in combination with existing monitoring networks, can be used to identify without detailed modelling (e.g. ADMS-Roads) what type of vehicle contributes most to air pollution at any location with appropriate data, helping to formulate policy to accelerate air quality improvements.
Summary
This blog has identified two major sources of information on air pollution that can be used by local authorities, or those with an interest in air pollution, to identify the main contributors to local air pollution. If you are a local authority who would like support with their Local Air Quality Management responsibilities or would like help in making the most of existing sources of data, please do not hesitate to get in contact.
Otherwise, if you have found this post interesting, please share it with your network and comment below.
