Greenavon routinely uses R’s openair software, Python and Tableau to analyse and visualise data. We have the capabilities to largely automate the production of data reports, and can carry out additional consultancy support to provide additional insight into the data.
How Greenavon can help?
It is common practice for companies to install air quality equipment and not aide in the analysis of the monitoring data. In this situation, we’d be happy to offer consultancy support to allow you to get the most out of your data.
Examples
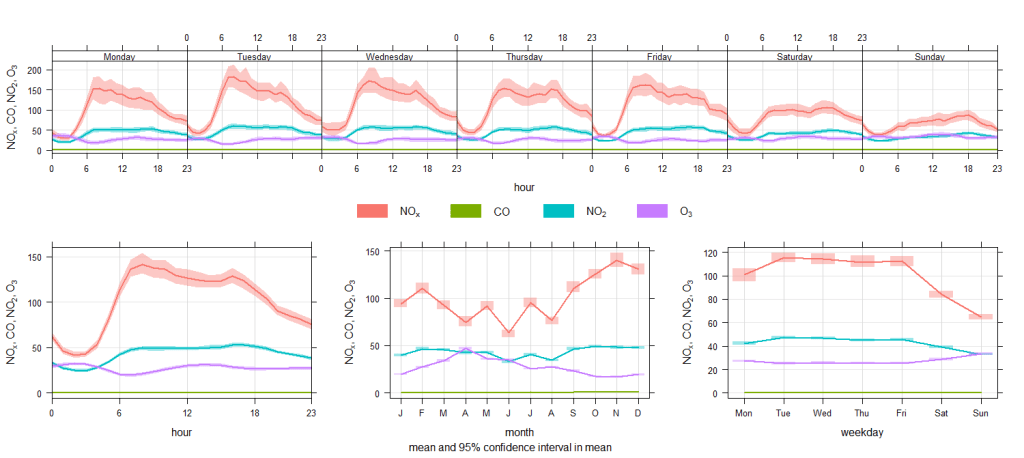
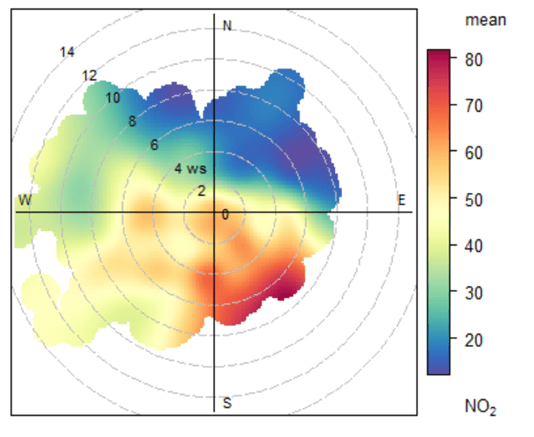
Our analytical techniques can help you identify sources of pollution, from the detailed analysis of temporal trends, or by identifying from wind direction the highest pollution concentration are found. Example outputs are provided below.

<script type='text/javascript'> var divElement = document.getElementById('viz1651497622366'); var vizElement = divElement.getElementsByTagName('object')[0]; vizElement.style.width='100%';vizElement.style.height=(divElement.offsetWidth*0.75)+'px'; var scriptElement = document.createElement('script'); scriptElement.src = 'https://public.tableau.com/javascripts/api/viz_v1.js'; vizElement.parentNode.insertBefore(scriptElement, vizElement); </script>

<script type='text/javascript'> var divElement = document.getElementById('viz1651497684998'); var vizElement = divElement.getElementsByTagName('object')[0]; if ( divElement.offsetWidth > 800 ) { vizElement.style.width='100%';vizElement.style.height=(divElement.offsetWidth*0.75)+'px';} else if ( divElement.offsetWidth > 500 ) { vizElement.style.width='100%';vizElement.style.height=(divElement.offsetWidth*0.75)+'px';} else { vizElement.style.width='100%';vizElement.style.height='727px';} var scriptElement = document.createElement('script'); scriptElement.src = 'https://public.tableau.com/javascripts/api/viz_v1.js'; vizElement.parentNode.insertBefore(scriptElement, vizElement); </script>


Business Hours
Upon request, Greenavon may be able to complete work outside regular hours.
- Monday
- 8:00 am – 6:00 pm
- Tuesday
- 8:00 am – 6:00 pm
- Wednesday
- 8:00 am – 6:00 pm
- Thursday
- 8:00 am – 6:00 pm
- Friday
- 8:00 am – 6:00 pm
- Saturday
- Closed
- Sunday
- Closed
Registered Office
128 City Road, London, United Kingdom, EC1V 2NX
Sitemap
Privacy Policy
Terms and Conditions
Phone: 020 8137 8495
Email: info@greenavon.com
